Most executives at mid-sized businesses find themselves relying on spreadsheets for operational analysis, planning and budgeting. Soon they’re dealing with multiple versions of spreadsheets, making these processes chaotic and error prone. As a result, they often feel they don't have their finger on the pulse of their company’s operations to quickly make enough right decisions.
Affordable analytics and planning technology can address this issue.
But many mid-sized organizations don’t have the budgets, resources and expertise to deploy such technology. This article identifies key issues with using spreadsheets for planning and analytics processes and shows a roadmap to deploy technology in an affordable manner to address these issues.
How does a typical mid-sized enterprise get these business insights today?
Information needed to gain business insights is typically within their enterprise business systems, but not easily accessible. Most mid-sized companies use manual methods to gain insights.
They start by extracting data from their systems into one or more spreadsheets, making changes to the data manually, and then emailing these spreadsheets around the company. These spreadsheet-based reports then serve as the nerve center of what is happening across their business at various levels of details. Soon there are multiple versions and the entire organization is drowning in irreconcilable spreadsheets.
Similarly, the planning process starts with finance creating planning templates; sending them to department heads; manually reconciling and aggregating their responses to create an initial draft of the company-wide plan and repeating this process multiple times to arrive at a final plan. Planning cycles in such a manually intensive process can be very long. In addition, spreadsheets do not have checks and balances when entering or updating data, so errors can creep in easily, creating a potential accuracy issue in reporting and planning.
Due to delays in manually creating spreadsheets, they also find that they often don't have access to the most current operational performance metrics or plans. They also find they have to go to different spreadsheet to “drill-down” to get to the root of the matter. As a result, it becomes challenging for them to put their finger on the pulse of their operations to quickly make decisions, make course corrections or reallocate resources.
Instead of making plans or decisions based on data, executives end up making them on their gut feel.
How can BI or planning technology address the spreadsheet chaos?
Business intelligence (BI) and planning technology addresses all the issues listed above for mid-sized companies. It helps turn data from their systems into useful and meaningful information, and then distribute this information to those that need it, when they need it, so every manager within the company can make timely and better-informed decisions. It enables mid-sized companies to succinctly surface what is working and what is not on an ongoing basis and showing their impact on the business, so managers can correctly prioritize and rapidly act/react.
It provides every manager within the organization with the same version of truth and ensures everyone is looking at the same plans and (hence) is on the same page.
Finally, it enables alignment between strategy and operations across organization – in terms of planning and resource allocation, as well as comparing planned vs. actual performance at various levels of detail.
So what are the capabilities of such a BI and planning system?
Operational reports that are run on a regular basis. An example might be a report that shows monthly demand forecast by product line, by geography and by sales channel.
Dashboards can help users quickly visualize the trends and spot issues using charts, gauges and red/yellow/green light statuses.
Ad hoc query enables users to answer question such as “How much of a specific part do we have in inventory across all distribution centers?”
Advanced analysis allows users to view data across multiple classifications or dimensions such as product, customer, region, time period etc. and then slice-and-dice the data, such as which products each customer purchased last year and then drill down into details.
Scorecards monitor business metrics and key performance indicators (KPI) such as customer satisfaction, profitability, and forecast accuracy per product group.
Budgeting and planning allows you to create top-down and bottom-up plans by cost centers/general ledger codes, collaboratively finalize them and publish them to the team to monitor, manage and track ongoing performance against such plans.
But with limited IT resources, budgets and expertise, how can a mid-sized organization deploy such a solution?
Roadmap for BI and Planning/Budgeting for mid-sized organization
We suggest a multi-phase deployment roadmap. This roadmap ensures that mid-sized organizations can start with small steps, achieve success and then build upon their success. It also enables the organization to prioritize high impact areas and incorporate potential change management issues.
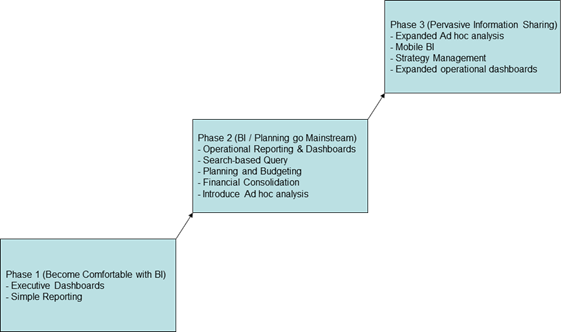
Figure: The three phases of BI and Planning Deployment
From our experience, a suggested roadmap for three phases of BI deployment is:
Phase 1 (Crawl): The objective in this phase is for organizations to become comfortable with BI Technology. Hence they should focus on deploying those aspects of BI that can have an immediate impact on their daily decision making, while providing the basis for organizational learning. We recommend in this phase mid-sized organizations deploy executive dashboards and simple operational reports using the BI technology.
For example, the VP of finance can begin to get a weekly report on revenue, receivables, and payables, while the CEO and his staff can begin to get interactive business dashboards.
Phase 2 (Walk): The objective in this phase is to build upon the success in phase 1 and expand the scope of BI to include operational reporting, detailed dashboards, ad hoc search query and ad hoc analysis, as well as budgeting and planning. Examples of use cases include:
The VP of Operations and his staff begin to get operational dashboards and reports that provide up-to-date information on inventory turns and gaps between demand and supply for key customers.
Executives can do search-based ad hoc analysis by entering a few keywords such as “plato laptop sales” in a search box and the BI system finds and presents the most relevant search results as well as automatically generates the chart that best represents the information.
Finance organization creates a streamlined and accurate budgeting and planning process, where department managers and the finance organization work collaboratively to create and finalize the budget
Phase 3 (Run): The objective in this phase is to achieve pervasive use of BI – so all decisions are made on facts rather than intuition. In this phase, mid-sized organizations can expand BI to mobile devices and roll out ad hoc query and analysis to all department business analysts.
Summary
A BI and planning solution enables mid-sized organizations to address the spreadsheet chaos and provides them deep and clear insights into their company to help them proactively identify, prioritize and address issues; improve organizational alignment and enhance resource utilization. The roadmap provided in this article enables resource and budget constrained mid-sized organizations to start small, get key learning and success under their belt and then build upon it to make fact-based decision making pervasive within their company.
Paul Clark is Senior Director of Analytics Marketing in the Global Ecosystems & Channels Solution Marketing Group at SAP (News  - Alert).
Edited by
Braden Becker


